Data-Driven Decision Making
See your business in real time with AI-powered dashboards. Steer AI combines market data, inspection outputs, and sales performance so you can set prices confidently, track margins, and prioritize inventory that moves.


Market Intelligence
Access demand heatmaps, comps, and price bands instantly

Condition-Aware Pricing
Factor inspection and reconditioning data into every decision
.svg)
Profitability Tracking
Monitor sales velocity, margins, and channel performance in real time
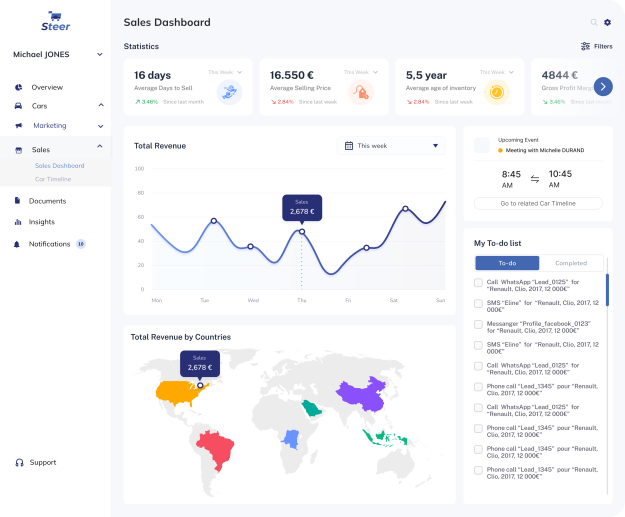
Smarter Insights for Confident Decisions
Steer AI unifies inspection results, sales performance, and market intelligence into a single dashboard. From setting precise pricing curves to monitoring margins and days-to-sell, our platform equips you with everything needed to make profitable, data-driven decisions.
Smarter Tools for Faster, More Accurate Pricing
.svg)
Market Heatmaps
.svg)
Dynamic Pricing Curves
.svg)
Profitability Dashboards
.svg)
Custom Reports
Grow Your Data-Driven Operations Seamlessly
Steer AI’s BI dashboards scale with your business. Add acquisition scorecards, reconditioning cost tracking, and governance-ready audit logs. Flexible and built to give you clear visibility from acquisition to sale.
Smarter Inventory Decisions, Faster Results
Steer AI delivers a single source of truth for inventory decisions. From real-time pricing insights to automated reporting, we help you maximize margins and accelerate stock rotation.
.svg)
Market & Pricing Dashboards
.svg)
Profitability & Sales Metrics
.svg)
Custom Reporting & Delivery
From Data to Decisions in 4 Simple Steps
Simplify Your Workflow in 4 Steps

Upload & Connect Data
Feed in inspection outputs and sales logs
.svg)
Analyze & Compare
View comps, demand heatmaps, and pricing curves
.svg)
Generate Reports
Auto-create dashboards and profitability insights
.svg)
Decide & Act
Adjust pricing, track margin, and rotate stock faster